Understanding AI-Powered Business Intelligence
Your Complete Guide to Modern Business Analytics and Data Visualization
Learn how AI is transforming business analytics, data visualization, and decision-making—empowering teams with self-service analytics and real-time dashboards without technical expertise.
What is Business Intelligence?
Business intelligence transforms raw data into actionable insights through data visualization tools, KPI dashboards, and predictive analytics.
The Traditional Way
For years, business intelligence tools meant:
- Hiring data analysts to build custom reports
- Learning SQL and complex business analysis techniques
- Waiting days or weeks for dashboard reporting
- Expensive enterprise reporting software with steep learning curves
- Data scattered across multiple systems
This made business analytics accessible only to large companies with dedicated teams and big budgets.
The AI-Powered Way
Modern AI data analytics and self-service BI change everything:
- Ask questions in plain English with intelligent analytics
- Connect all your data sources with automated analytics
- Get instant visual analytics with interactive dashboards
- No coding or business analysis methodologies required
- Everyone on your team can explore data discovery tools
Now any business can access enterprise-grade business intelligence reporting tools at a fraction of the cost.
How AI-Powered Business Intelligence Actually Works
Four simple steps turn your data into visual analytics and real-time dashboards
0. Your Data Stays Yours
Read-only access means we analyze, never alter. Your data remains in your environment—we never store, modify, or move it.
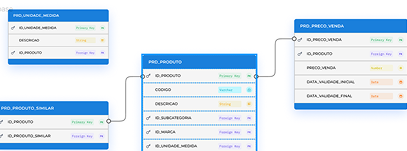
1. Connect Your Data
Link your CRM, finance tools, marketing platforms, databases, and spreadsheets. AI automatically understands your data structure and relationships.
2. Ask Questions
Type questions like "What's my revenue by channel this month?" or "Which customers are at risk of churning?" No SQL required.
3. Get Instant Answers
AI generates charts, tables, and insights in seconds. Share with your team, export reports, or dig deeper with follow-up questions.
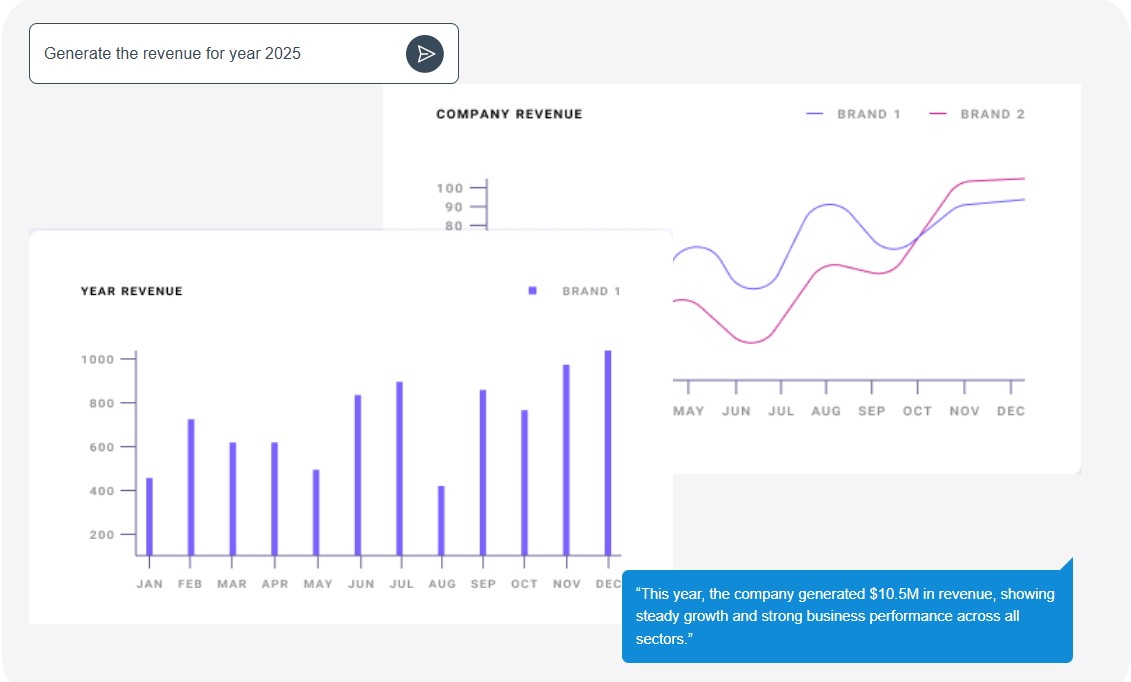
Example: Real-Time Business Intelligence in Action
Instead of writing complex SQL queries or waiting for a data analyst, simply ask: "Show me our top 10 customers by revenue this quarter, and compare to last quarter."
The AI instantly pulls data from your sales system, calculates business performance metrics, and presents a clear data visualization—complete with percentage changes and predictive analytics insights.
Why Your Business Needs Modern Business Analytics
| Without Business Intelligence Tools | With AI-Powered Self-Service Analytics |
|---|---|
| Data scattered across multiple systems | ✓ Unified business intelligence dashboard with all data sources |
| Decisions based on gut feeling or outdated spreadsheets | ✓ Data-driven decision making with real-time analytics |
| Hours spent manually pulling reports | ✓ Automated reporting and KPI tracking |
| Only data analysts can answer questions | ✓ Self-service BI empowers everyone on your team |
| Insights arrive too late to act on | ✓ Real-time dashboards spot trends instantly |
For Founders
See your entire business in one KPI dashboard. Track revenue, pipeline, churn, and business performance metrics without relying on fragmented team updates.
For Marketing Teams
Connect campaigns to revenue with marketing analytics. Prove ROI instantly with automated reporting on CAC, LTV, and funnel conversion rates.
For Operations
Forecast accurately with unified operational analytics. Stop being dragged into "can you pull this number" requests with self-service analytics.
For Sales Leaders
Real-time sales analytics showing pipeline health across all reps. Automated forecasting with business intelligence dashboards that tie sales stages to financial data.
For Customer Success
Identify at-risk customers instantly with customer analytics. Correlate support tickets with retention and revenue impact using predictive analytics.
For Finance
Reconcile revenue, refunds, and churn automatically with performance analytics. Connect sales pipeline to financial forecasting with real-time dashboards.
Getting Started with Business Intelligence Tools
No technical skills, no long implementation, no expensive data analysts
What You'll Need
- Access to your data sources (CRM, finance tools, databases)
- 5 minutes to connect your first data source
- Questions you want answered about your business performance metrics
- That's it. No coding, no business analysis methodologies, no IT team required.
Most teams are creating their first KPI dashboard and getting visual analytics within 10 minutes of signing up.
Frequently Asked Questions
What is Analysis GPT?
Analysis GPT is an AI-powered business analytics tool that lets you query, analyze, and visualize your data without special skills or coding knowledge. Acting as your virtual data analyst, it connects to databases, CRMs, finance, and sales tools, helping you uncover insights through simple natural language queries. Whether you're exploring key business performance metrics or building interactive dashboards, Analysis GPT makes data analysis fast, intuitive, and accessible for everyone.
Do I need technical skills to use Analysis GPT?
Not at all. Analysis GPT is designed so anyone on your team can get insights without writing a single line of code. You can ask questions in plain language — like "Show me sales by region this quarter" — and get instant answers, charts, and dashboards. If you're more technical, you can still dig deeper using SQL or custom queries, but it's completely optional.
How secure is my data?
We take data security seriously. Analysis GPT only reads your data to provide insights — we never store it, and we have no ability to alter your data in any way. All connections use end-to-end encryption, and credentials are stored securely with industry-standard protocols.
Our platform meets strict compliance standards, including GDPR, ISO 27001, and SOC 2 certification. Access is limited to authorized systems and users only. For more details, visit our Trust Center at trust.saigroups.com.
Can Analysis GPT generate charts and dashboards?
Yes! Analysis GPT not only provides textual answers to your queries but also creates charts, graphs, and interactive dashboards to help you visualize your data. You can use pre-built templates for finance, sales, marketing, or customer experience, or build your own custom dashboards. Analysis GPT also supports combining multiple datasets so you can see your insights in one unified view — making it easy to track business performance metrics, explore trends, and tell your data's story.
Ready to Transform How You Work with Business Analytics?
See how AnalysisGPT makes business intelligence tools accessible to everyone on your team with self-service BI and real-time dashboards. No credit card required.
 AnalysisGPT
Reliable AI For Every Conversation
Powered by ![]()

@ 2018-2026 SAI Group