Stop Fighting Excel.
Start Getting Answers.
See the exact same analysis, one way takes hours of formulas and pivot
tables, the other takes 10 seconds.
✖ THE EXCEL WAY
⏱ 2–4 hours
✔ THE ANALYSISGPT WAY
⚡ 8 seconds
TASK-BY-TASK BREAKDOWN
Same Tasks. Wildly Different
Experience.
Task
Excel
AnalysisGPT
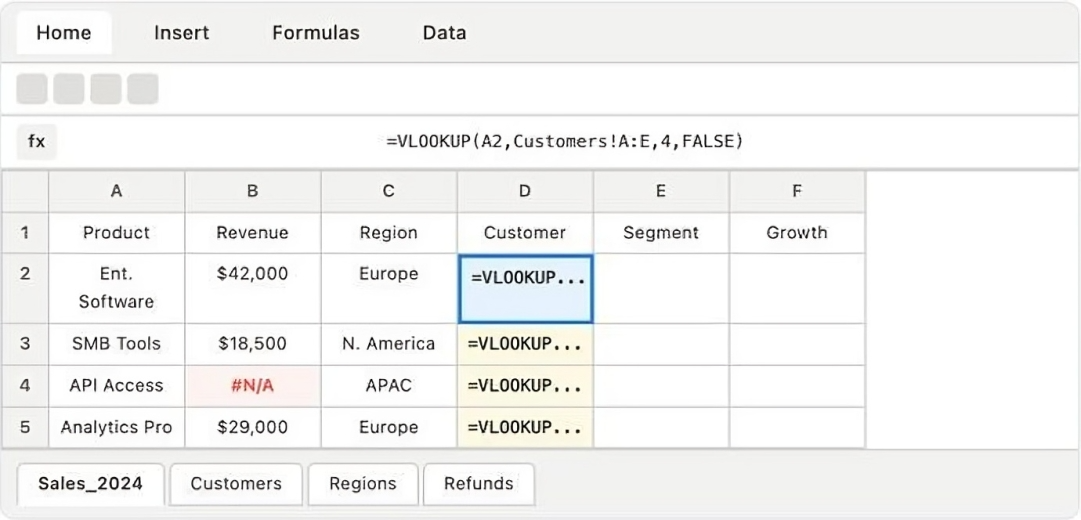
Join data across sheets
×
Write VLOOKUP formulas
=VLOOKUP(A2,Sheet!A:D,3,0)
✓ Automatic, all sheets connected
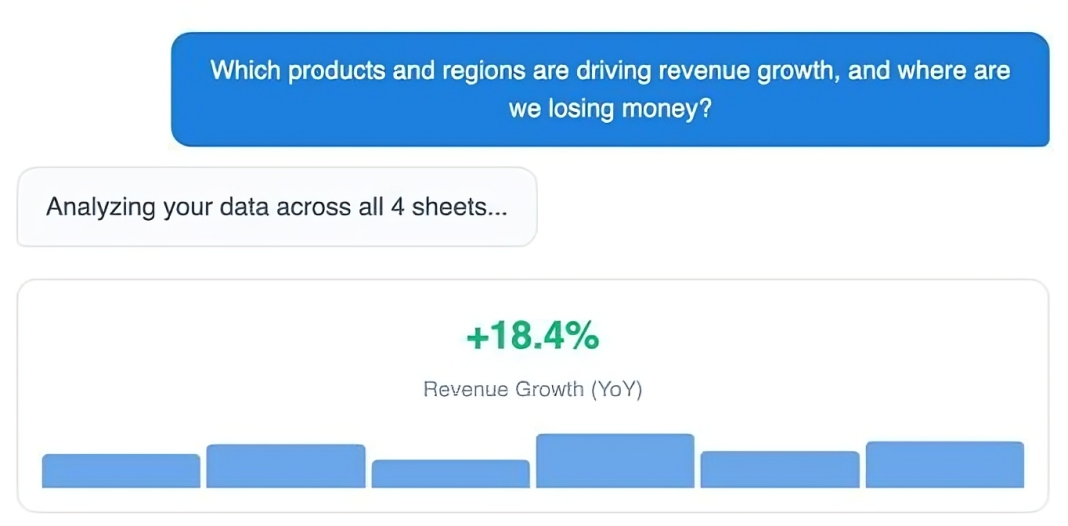
Calculate YoY growth
× Helper columns + SUMIF + manual math
✓ “What was revenue growth YoY?”
Find top refund products
× Sort → filter → pivot → RANK formula
✓ “Which products have highest refund rates?”
Create visualizations
× Chart wizard → format → copy to PPT
✓ Generated automatically with answer
Write executive summary
× Stare at data, type manually
✓ Written automatically in plain English
THE RESULT
Same Insights. Same Accuracy. 2 Hours vs 8 Seconds.
📈 Revenue Growth
+18.4%
Year-over-year total revenue
- Enterprise Software grew +32%
- SMB Tools declined −9% in Q4
- API Access emerging segment
🌍 Regional Performance
+27%
Europe, fastest growing region
- N. America: highest revenue, flat
- Europe: fastest growth at +27%
- APAC: rising refunds hurting margins
⚠️ Risk Areas
41%
of refunds from just 2 products
- SMB Tools + API Access drive refunds
- APAC margins shrinking despite sales
- Refund rate growing 3× faster than revenue
"Revenue growth is being driven by Enterprise Software sales in Europe, while increasing refund rates in APAC are reducing overall profitability."
Excel: 2-4 hoursAnalysisGPT: 8 seconds
Try AnalysisGPT Today
Upload your Excel file. Ask your question. See the difference.
 AnalysisGPT
Reliable AI For Every Conversation
Powered by ![]()

@ 2018-2026 SAI Group