Know Your Business
Like You've Always
Wanted To
Connect your data sources, ask the questions that drive decisions. Get structured, transparent analysis you can trust, and defend.
Stop asking "what happened."
Start asking "why."
AnalysisGPT is built for the kinds of questions analysts actually ask, not surface
metrics, but the insights behind them.
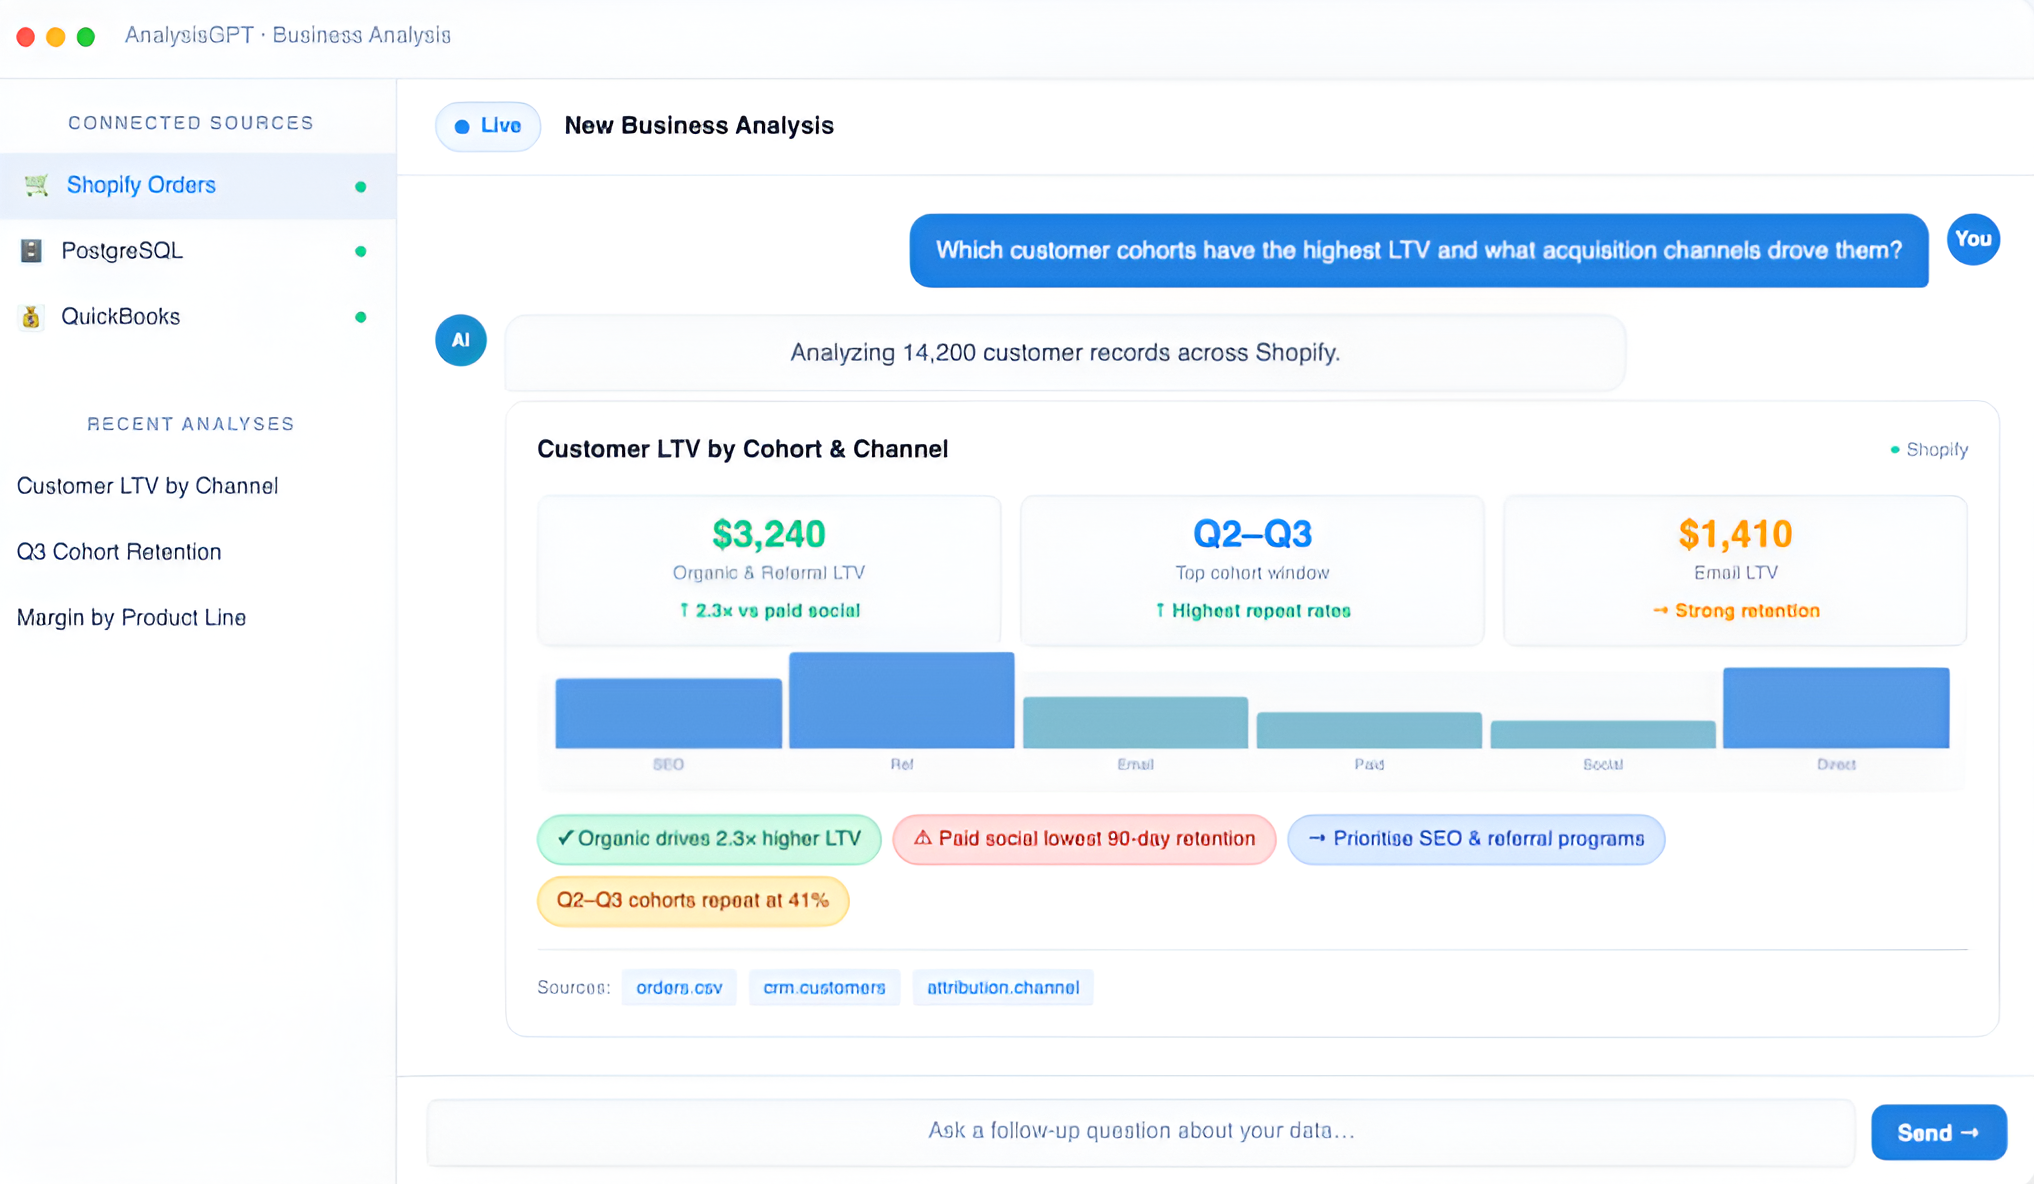
Which revenue segments are growing fastest and what's driving the divergence?
Enterprise Software grew +32% YoY driven by a single Q2 expansion cohort in Europe. SMB Tools declined -9% in Q4 after the pricing change in October, the drop aligns with a 14-day lag post-announcement. API Access is early-stage but compounding at 8% MoM.
Answers You Can Actually Defend
Every result is traceable. No black boxes. No guesswork. No hallucinated
numbers.
Built for people who own the numbers
Whether you're reporting to the board or trying to understand why last month
was down, AnalysisGPT gives you clarity fast.
- Cohort analysis across acquisition channels
- Root-cause investigation of metric changes
- Cross-source trend attribution
- Why did CAC increase last quarter?
- Which channels are profitable at scale?
- Where is churn concentrated?
- Margin breakdown by product & region
- Variance analysis vs. budget
- Revenue forecast with assumptions visible
From data to insight in three steps
Know Your Business Like
You've Always Wanted To
Connect your data, ask the questions that matter. Get answers in seconds, not spreadsheets.
 AnalysisGPT
Reliable AI For Every Conversation
Powered by ![]()

@ 2018-2026 SAI Group